In This Topic
Nevron Chart for SharePoint can be visually edited in any major web browser, though a web based designer. The chart designer is invoked by the "Run Chart Designer" toolbar command, which appears above the web part in page editing mode. The chart designer header consists of two important controls - the main toolbar and the main tab strip as shown by the following screenshot:
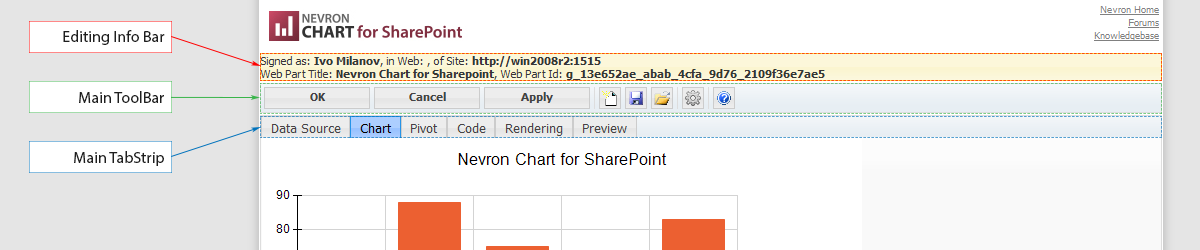
The editing info bar provides information about the currently edited web part, the current SharePoint user and the location of the edited web part in SharePoint.
The main toolbar provides access to the main commands related to the webpart that you edit - see The Main Toolbar for more info.
The main tabstrip provides access to different web part settings - following is a brief overview of its pages:
- Data Source Page - lets you connect the chart to a data source.
- Chart Page - exposes properties of the chart areas, legends, titles etc.
- Pivot Page - provides a visual interface to the chart pivot.
- Code_Page - provides a visual interface for custom code injection.
- Rendering Page - exposes properties related to chart rendering.
- Preview Page - lets you see a WYSIWYG preview of the current chart configuration.
The main toolbar has the following commands:
- OK - saves any changes in the edited web part and returns you to the edited page (leaves the designer).
- Cancel - discards any changes to the web part and returns you to the edited page (leaves the designer).
- Apply - saves any changes in the edited web part and lets you continue the editing (does not leave the designer).
- Reset - lets you reset the web part to a blank (default) one. The blank web part is not connected to any data source and is the web part with which you start by default.
- Save - saves the current state of the web part to an external file. You can later load this state file in any other web part.
- Load - loads a previously saved state file.
- View Web Parts Config - lets you inspect the global settings under which the webpart operates. See the The WebParts Config File for more info.
- Help - opens the web help of the Nevron SharePoint Vision product.
No changes are applied to the edited web part until you click the OK or Apply buttons.
The Data Source page lets you connect the chart to a tabular data source. Currently you can bind the chart to the following types of data sources:
- Database
- SharePoint List
- SharePoint Site Query
- Excel Services
- Business Data Catalog
- Web Part Table
See the Connecting to Data topic for a complete discussion.
 |
The chart must be connected to a data source prior to editing the rest of its settings. That is why for a blank web part the Data Source page is displayed first. Once specified, it is not recommended to change your data source, since expressions that you write may reference field values from the data source.
|
Nevron Chart for SharePoint supports multiple chart areas, legends and titles. These chart elements are fully editable from the Chart Areas, Legends and Titles sub-tabs of the Chart page. See the Chart Areas, Legends and Titles topics for a full description of the settings per each of these elements.
The Layout and Appearance sub-tabs of the Chart Designer tab control general layout and appearance settings, which are not associated with a particular chart area, legend or title. See Understanding the Chart Layout and Customizing the Chart Appearance for a complete discussion.
For a chart web part that is already connected to a data source the Chart Page is displayed by default.
Nevron Chart for SharePoint is built on top of the Nevron Pivot Engine. The Pivot page lets you define the category, series and values data grouping of the chart pivot, as well as edit the grouping, sorting and filtering rules associated with them. Creating new value, category and series data groupings is performed by dragging and dropping data set fields in the respective drop spots.
See the The Chart Data Model for a complete discussion of the chart pivot. The Values Data Groupings and Category and Series Data Grouping topics explain the properties of the values and categories/series data groupings in details.
Nevron Chart for SharePoint allows for users with development experience in C# or VB.NET to inject custom code, which is executed at runtime. The code injection is dynamic meaning that no deployment of assemblies is needed for the injected code to run. See
Code Injection for more information.
The Rendering page lets you tune the image rendering options of the chart. See the
Rendering Options for more information.
The Preview page lets you see a WYSIWYG preview of the webpart as it will appear at runtime. The preview is generated with the processed chart pivot and uses the current data source state.
Browser Compatibility
The Designer is compatible with all modern web browsers (Chrome, FireFox, Opera, IE 11/10/9/8/7 etc.). Browser compatibility is ensured by the JQuery JavaScript library and a common CSS layer developed by Nevron.
See Also