The Nevron Pivot Engine stays behind all data aggregation / analysis features provided by Nevron web parts. It uses formula expressions, which gives you flexible control over grouping, filtering and sorting and also provides the ability to define dynamic property values based on formulas.
The Nevron Pivot Engine has a design model, which is visually edited directly in the browser by the respective web part pivot designer. Different web parts are providing a different interface towards the pivot design model. The Chart Data Model and The Gauge Data Model topics, describe the pivot design model used by the respective web part.
At runtime the design model is processed towards the current state of the data set to produce a runtime state, which is then rendered by the webpart. It is important to know that for the same design model the runtime state can be different, depending on the data set which is processed.
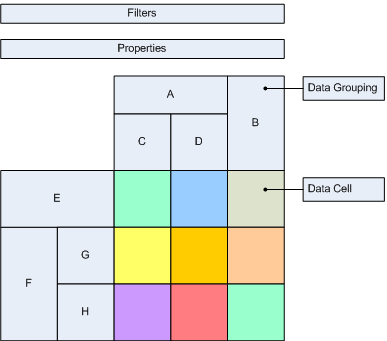
The following images illustrate a simple pivot at design time and runtime:
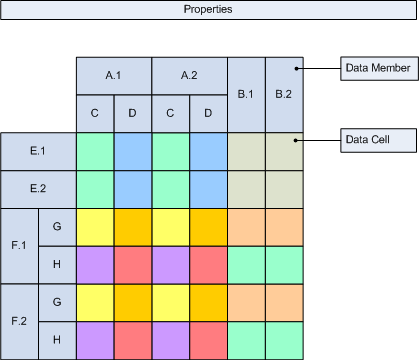
| Figure 1. Design Time | Figure 2. Runtime |
 |
 |
In Figure 1 you can see a sample pivot at design time. It is assembled from filters, properties, hierarchically organized row and column data groupings and a grid of data cells, which is sized to the count of leaf row and column data groupings.
In Figure 2 you can see a sample pivot at runtime. It is produced for the design model at Figure 1, assuming that the A, B, E and F data groupings produced only 2 data members each and also assuming that the C, D, G and H data groupings had no grouping expressions. The color coding helps you see the span of each data cell.
Following is a brief description of the terms used in the pivot engine documentation:
data grouping and data members - a data grouping defines expressions for grouping, filtering and sorting. When a data grouping is processed it creates one or more data members - one data member for each group. Data members are filtered and sorted with the data grouping filters and sorting rules. The resulting data members are recursively passed for processing to the child data groupings (see Grouping, Filtering and Sorting).
data cells - a data cell is a container for properties. At runtime, the properties of a single design time data cell are evaluated and copied to all the intersections of the row/col data members created for the leaf row/col data groupings, for which the design time data cell was created.
property - at design time a property is a a {name:expression} pair. At runtime a property is {name:value} pair, where the value is taken from the result of the expression evaluation. A pivot model stores properties in three places:
- global properties
- data grouping
- data cell
data set and fields - a data set is any tabular data source the columns of which are called fields.
recordset - a recordset is an enumeration of a subset of records (rows) from a data set. A recordset is EMPTY, if it contains no records. A recordset is FULL, if it contains all the records from the data set. The intersection of recordsets R1 and R2 is a recordset, which contains records that exist in both R1 and R2.
scope - a scope is generally a reference to a recordset. Expressions are always evaluated in the context of some scope, which results in different values based on the scope recordset. Scopes are hierarchical in nature, since pivot processing is performed hierarchically.
expression - an expression is a formula string, which is evaluated in the context of a scope (e.g. the same expression may evaluate to a different value given a different scope). Expressions are used at design time in properties, groupings, sortings and filters (see Expressions).
The process of converting a design time pivot to a runtime pivot is known as pivot processing and is briefly described in the Pivot Processing topic.