Categorical scales are used to scale discrete values. Common example of such values are all type of string data such as company name, region etc. The values on a categorical scale can be grouped in two or more levels depending on the category fields you dropped in the chart designer. Each categorical scale has the following settings:
Step Mode - defines how the scale will choose a step to place the major ticks and labels on the scale in case it is a single level categorical scale. You can choose from three modes:
- Min Distance - in this mode the scale will automatically calculate the step depending on the value of "Min Distance" (specified in points) and will not allow ticks to be closer than the specified distance. In this mode the number of scale ticks will increase as the scale is bigger on the screen or printer and decrease when the scale is smaller respectively. This is the default setting.
- Max Count - in this mode the scale will automatically generate steps depending on the value of "Max Count". In this mode the number of ticks will be restricted to the maximum allowed number of ticks. The scale will automatically select a "nice" step given the range of the data and the number of ticks will be constant when the scale is resized.
- Custom Step - in this mode you can explicitly specify a custom step. The step is specified with the "Custom Step" spin.
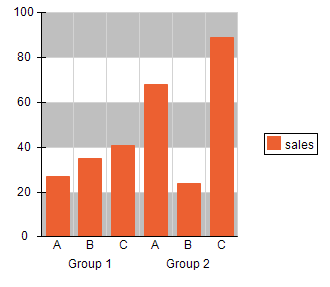
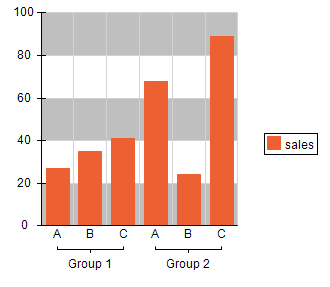
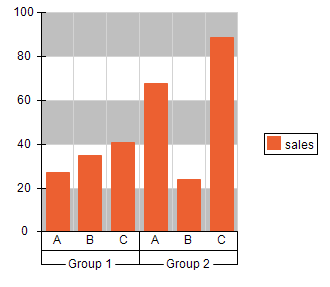
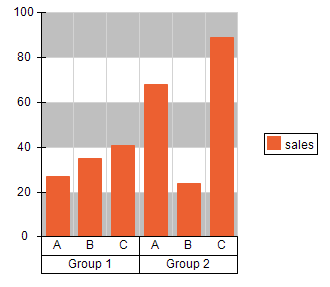
Grid Style - controls the style of grouping labels when the scale has two or more levels. The following pictures show the effect of the different values available for this setting:
| None Grid Style | Stick Grid Style |
 |
 |
| Bracket Grid Style with enabled row separators | Grid Grid Style with enabled row separators |
 |
 |
None - in this mode the scale will not visualize any grid lines and will center group labels relative to the first level labels they group.
Stick - in this mode the scale will show three stick denoting the first and last labels in the group as well as the center of the grouping label. You can also control the stick length through the "Stick Length" setting.
Bracket - in this mode the scale will visualize brackets around the grouping label that extend from the start of the first label to the end of the last label that are being grouped. The following settings apply when the scale grid style is switched to bracket:
- Show Row Separators - defines whether the scale should display level separators, that separate the rows of the scale.
- Show First Row Label Separators - defines whether first row vertical label separators should be displayed.
- Group First Row Label Separators - defines whether first row vertical label separators must be display only at the begin/end of each grouped label.
On the picture above showing the bracket grid style all three options are checked.
Grid - in this mode the scale will visualize a grid around the labels. The following settings apply when the scale grid style is switched to grid:
- Show Row Separators - defines whether the scale should display level separators, that separate the rows of the scale.
- Show First Row Label Separators - defines whether first row label vertical separators should be displayed.
- Group First Row Label Separators - defines whether first row vertical label separators must be display only at the begin/end of each grouped label.
On the picture above showing the grid grid style all three options are checked.
Group Label Text Style - allows you to change the group label text style. When the scale uses grouping (e.g. when you dropped several category fields) you can optionally change the text style for group labels.
Show Ticks Between Data Points - defines whether tick marks must be displayed between data points. When unchecked tick marks will be displayed at the data point center. This setting is ignored when the scale displays grouped categorical data.
First Level Label Fit Mode - defines how category labels from the first row will behave when they overlap or extend beyond the range they annotate. The default setting is "Value". For more information on label fit modes check out the Advanced Axis Settings topic.
First Level Label Angle - defines the initial angle of category labels from the first row. Note that the actual angle may change depending on the settings for automatic label overlapping resolve as described above. For more information on scale label angles check out the Scale Label Angle topic.
Group Level Label Fit Mode - defines how category labels from the second and higher rows will behave when they overlap or extend beyond the range they annotate. The default settings is "Range". For more information on label fit modes check out the Advanced Axis Settings topic.
Group Level Label Angle - defines the initial angle of category labels from the group row.