In This Topic
Nevron Gauge for SharePoint uses the Nevron Pivot Engine. In order to better understand how to work with the gauge and bind it to data you should have a general understanding of the Nevron Pivot Engine - see the Pivot Engine - Getting Started topic.
Each gauge webpart has a design model and runtime state. The design model of the gauge defines how it merges with the actual data, which is provided at runtime. The runtime state represents the gauge when the data has been processed and merged with the design model of the gauge.
Because not every Matrix model is suitable for a gauge, Nevron Gauge for SharePoint uses a simplified model, which is better suited for this purpose. Figure 1 illustrates the design model of the gauge:
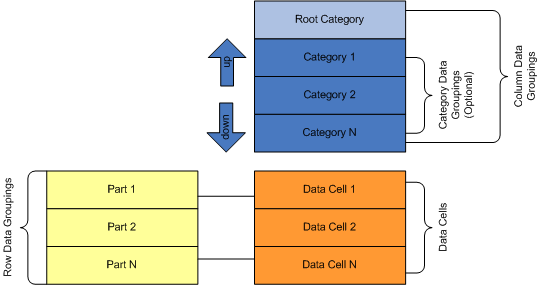
Figure 1 - The Gauge Data Model
There are three types of data groupings - root category, categories and gauge parts.
Collectively, the root category and the category data groupings define how data cells expand in the column direction. Category data groupings are dynamic - they represent a grouping of the data based on some expression conditions (typically a field value). At runtime, each category data grouping expands to one or more group members.
The root category is static - at runtime there is again only one root category. The root category is always present and cannot be edited. That is why the category data groupings are optional - the gauge always has one leaf column data grouping serving as a column placeholder for the gauge part data cells (see below).
The column hierarchy is simple and represents a parent-child chain. Each category data grouping has exactly one parent, except the root category, which has no parent. Each category has exactly one child category, except the last category, which has no children. For example: Category 1 is a parent of Category 2 and Category 2 is the one and only child of Category 1. Moving categories up and down from the visual interface in fact makes changes in this parent-child chain (for example: moving Category 2 up makes Category 2 the child of the root category. Category 1 becomes the only child of Category 2 and if Category 2 had a child it becomes a child of Category 1). The root category always stays on top.
Gauge part data groupings are static - at runtime exactly one data grouping member is created for each gauge part. A gauge part is a row placeholder for a data cell. Gauge parts are automatically created/destroyed for gauge axes, ranges, pointers and numeric display and state indicator values. The data cell associated with a gauge part contains the needed properties for the respective gauge element (for example: a gauge part data cell created for a gauge axis will have min and max properties, a gauge part data cell created for a gauge pointer will have a value property etc.).
At runtime, the data cell for a gauge part will span all leaf category members. This generates a set (list) of values for each data cell property. The gauge element, owning the gauge part, extracts a single value from this set by using a statistical formula - see Gauge Formulas for more information.
Examples
Too complex? Lets see some examples. Consider this data set:
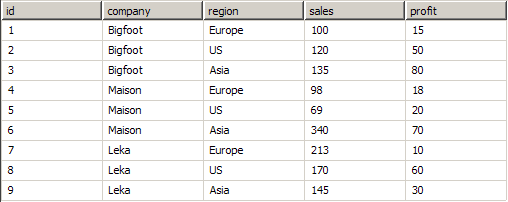
Company names and data are fictional.
Suppose that you want to create a gauge that displays the average total sales per company (regardless of region). Follow these steps:
1. The gauge has one category data grouping, which groups data by the company field value.
2. In the Gauge Area > Axes Tab - set the Min expression to =SUM(Fields!sales). Ensure that the gauge formula is set to Min.
3. In the Gauge Area > Axes Tab - set the Max expression to =SUM(Fields!sales). Ensure that the gauge formula is set to Max.
4. In the Gauge Area > Pointers Tab - set the Value expression to =SUM(Fields!sales.Value). Ensure that the gauge formula is set to Average.
Data-wise this is equivalent to the following matrix at design time and runtime:
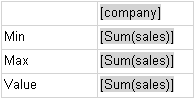
Matrix 1 Design Time:
Matrix 1 Runtime:
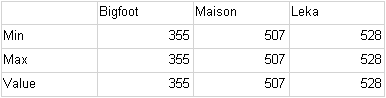
The matrix data rows have the same values. The gauge however uses a statistical formula to obtain a single value from each row. The values it gets are:
Axis Min - 355 (Min of (355, 507, 528))
Axis Max - 528 (Max of (355, 507, 528))
Pointer Value - 463.33 (Average of (355, 507, 528))
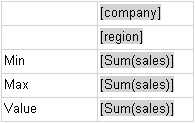
The role of the category groupings is now obvious - they define the way in which you sample the data. If you want to display the average sales per company by region you just need to add one more category data grouping - for the region. Data-wise this is equivalent to the following matrix:
Matrix 2 Design Time:
Matrix 2 Runtime:
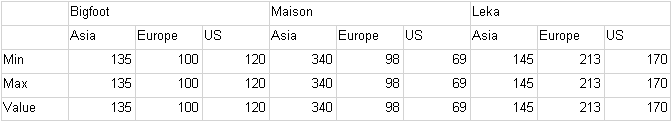
At runtime the gauge gets the following values:
Axis Min = 69 (Min of (135, 100, 120, 340, 98, 69, 145, 213, 170))
Axis Max = 340 (Max of (135, 100, 120, 340, 98, 69, 145, 213, 170))
Pointer Value = 154.44 (Average of (135, 100, 120, 340, 98, 69, 145, 213, 170))
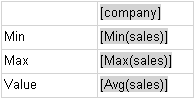
When there are no category data groupings, at runtime there is only one data cell per data row (because the root category is always present and is static). In our sample dataset the {company:region} pair is a key (e.g. there is only one record, which corresponds to a {company:region} value). So it makes sense to make the same gauge by using the aggregate functions of the Nevron Pivot Engine. Configure the gauge in this way:
1. Remove all category data groupings
2. In the Gauge Area > Axes Tab - set the Min expression to =MIN(Fields!sales). Ensure that the gauge formula is set to First.
4. In the Gauge Area > Axes Tab - set the Max expression to =MAX(Fields!sales). Ensure that the gauge formula is set to First.
5. In the Pointers Tab - set the Value expression to =AVG(Fields!sales). Ensure that the gauge formula is set to First.
The equivalent data matrix is shown below.
Matrix 3 Design Time:
Matrix 3 Runtime:
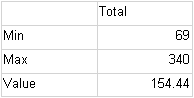
In the case when there are no category data groupings, you will typically use the aggregate functions of the Nevron Pivot Engine and set the gauge formula to First.
In the case when there are data groupings, you will typically use the SUM function of the Nevron Pivot Engine and an applicable gauge formula (MIN for axis min, MAX for axis max etc.) .
See Also