The Chart Twinning feature allows to share the axis space of two horizontally or vertically adjacent charts. This is commonly used when you have horizontally or vertically stacked charts that show common data on their X or Y axis. For example consider the following chart:
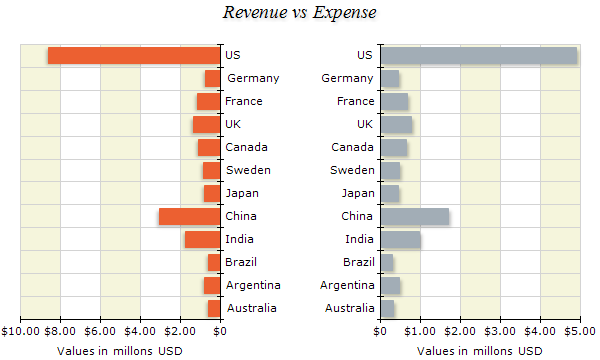
It shows two charts with right to left and left to right orientation that show identical data on their X (category) axis. Chart twinning allows you to instruct the control to merge the area occupied by adjacent axes of two different charts. This allows you to hide the axis of the first or second chart in order to display only one of the two and therefore increase the space available to the chart plots on both sides. The following picture shows the same chart but with twinning enabled:
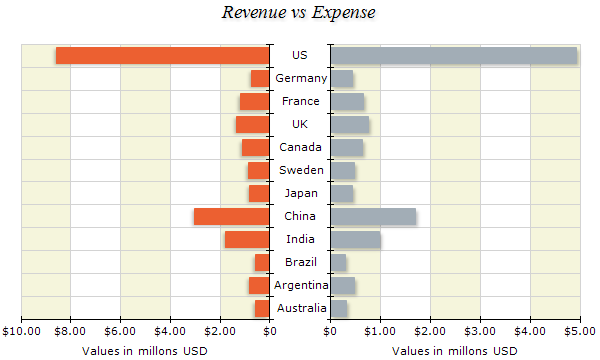
Note that in this chart the first category axis is hidden (Chart Area 0\Axes\PrimaryX\Visibility).
Enabling Chart Twinning
In order to enable chart twinning you need to go the Properties\Layout page. Then locate the Twin Charts group of controls:
Twin Horizontally Adjacent Charts - when checked horizontally adjacent charts will ignore the settings for padding and margins for the respective side (left or right) and resize so that left or right axes touch.
Twin Vertically Adjacent Charts - same as above except that the top and bottom chart sides are twinned.
After you enable twinning you can optionally disable it per chart panel by going to the Chart\Chart Areas\Twinning page. It allows you to disable twinning for a particular chart area side.