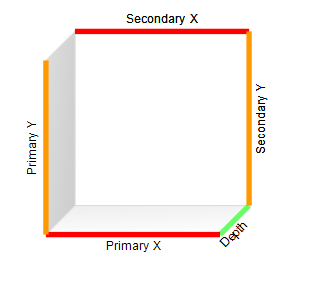
The Axes page of the currently selected charting type is filled with the Cartesian axes, in case the currently selected charting type of the chart area is a Cartesian chart (see Chart Areas for more info). The Cartesian Axes model consists of five axes in 3D and four axes in 2D, as shown by the following images:
|
Cartesian Axes in 3D |
Cartesian Axes in 2D |
|---|---|
 |
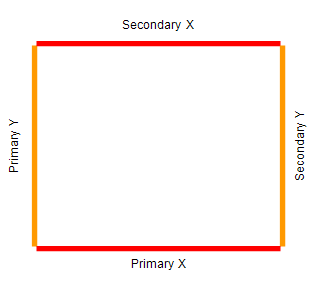 |
| Axis | Topic | Description |
|---|---|---|
| Primary Y | Y Axes | The default Y axis on which the chart series produced by the values data grouping are scaled in the chart Y dimension. By default displayed at the left chart side. |
| Secondary Y | Y Axes | Optional. To scale a values data grouping on the secondary Y axis, go to Data Groupings > Values > General > Options and change the Y Axes property to SecondaryY or Both. By default displayed at the right chart side. |
| Primary X | X Axes | The default X axis on which the chart series produced by the values data grouping are scaled in the chart X dimension. By default displayed at the bottom chart side. |
| Secondary X | X Axes | Optional. To scale a values data grouping on the secondary X axis, go to Data Groupings > Values > General > Options and change the X Axes property to SecondaryX or Both. By default displayed at the top chart side. |
| Depth | Depth Axis | Only displayed in 3D. In all cases however it defines the Z order of the chart series produced by all values data groupings displayed in a Cartesian chart area. |
Cartesian Axes share a number of common settings related to title, scale, range etc. For a brief description of these settings check out the Common Axis Settings topic.